
Richmond Houses with Suite for Sale
Richmond houses with legal suites are comparatively rare, which means they command a premium when listed — a fully self-contained secondary suite in a Richmond detached home is a genuine asset in a market with very low vacancy rates. There are currently 76 houses with suite for sale in Richmond. Prices range from $1,279,000 to $11,990,000. Browse all MLS® listings below, complete with sold history, floor plans, and daily updates. Richmond City permits secondary suites in most single-family zones. Recent development in West Cambie and McNair includes purpose-designed suites with separate entrances. Proximity to YVR and the Canada Line makes Richmond suites attractive to airline and hospitality workers. A 1-bedroom legal suite in Richmond typically rents for $1,500–$2,100/month; 2-bedroom suites achieve $1,900–$2,500/month, reflecting Richmond's tight rental market.
Market summary
The suite-equipped houses market in Richmond is currently a Buyer's Market with a 1.3% sales ratio — 1 homes sold against 76 active listings in the past 30 days. The median asking price is $2,698,900 ($771/sqft). Properties are selling quickly, averaging 14 days on the market.
No active listings match this search
There are no properties matching your current filters. Recently sold results are shown below.
Clear filtersRecently Sold


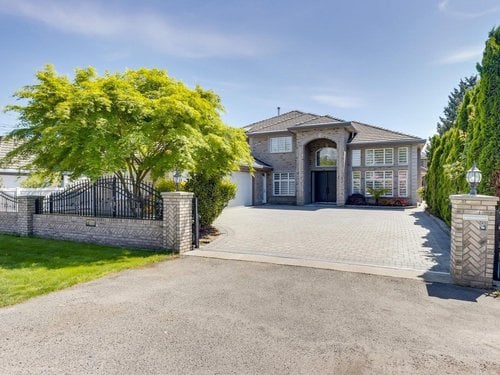


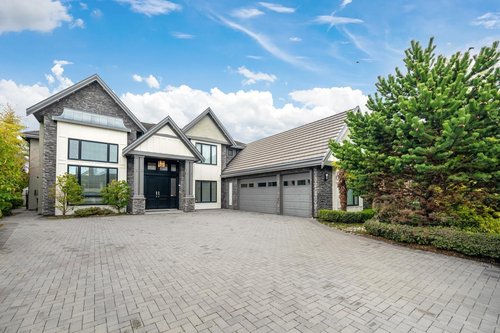


Also Explore
Richmond House With Basement Richmond House New Construction 1 Bed House in Richmond 2 Bed House in Richmond 3 Bed House in Richmond 4 Bed House in Richmond 5 Bed House in RichmondMarket Activity by Price Range — Richmond
| Price Range | Active | Sold (30d) | Sales Ratio | Activity |
|---|---|---|---|---|
| $1.25M–$1.5M | 3 | 0 | 0% | |
| $1.5M–$1.75M | 7 | 0 | 0% | |
| $1.75M–$2M | 4 | 0 | 0% | |
| $2M–$2.5M Most Active | 16 | 1 | 6% | |
| $2.5M–$3M | 25 | 0 | 0% | |
| Over $3M | 21 | 0 | 0% |
Sales ratio = homes sold in last 30 days ÷ active inventory. Over 20% = Seller's Market.
Market Activity by Neighbourhood — Richmond
| Neighbourhood | Active | Sold (30d) | Sales Ratio |
|---|---|---|---|
| Ironwood | 9 | 1 | 11% |
| Seafair | 7 | 0 | 0% |
| Woodwards | 7 | 0 | 0% |
| McNair | 7 | 0 | 0% |
| Saunders | 6 | 0 | 0% |
| Broadmoor | 5 | 0 | 0% |
| Riverdale RI | 3 | 0 | 0% |
| McLennan | 3 | 0 | 0% |
| Steveston North | 3 | 0 | 0% |
| Steveston South | 3 | 0 | 0% |
| East Richmond | 3 | 0 | 0% |
| Sea Island | 2 | 0 | 0% |
| Gilmore | 2 | 0 | 0% |
| Granville | 2 | 0 | 0% |
| West Cambie | 2 | 0 | 0% |
| Bridgeport RI | 2 | 0 | 0% |
| South Arm | 2 | 0 | 0% |
| East Cambie | 1 | 0 | 0% |
| Lackner | 1 | 0 | 0% |
| Westwind | 1 | 0 | 0% |
Explore More in Richmond
Frequently Asked Questions — Richmond
Get Expert Help in Richmond
Our team has sold 300+ homes in this area. Get a free home valuation or buyer consultation.
Sign Up Free — See Sold Prices